

Candlestick Patterns - Part 1
Doji Candlestick
A Doji candlestick is formed when the closing price is just above or below
the closing price. It shows indecisiveness in the market. The candle next to
the doji candle can be taken as the confirmation candle. It has long upper
and lower shadows and a very short body.
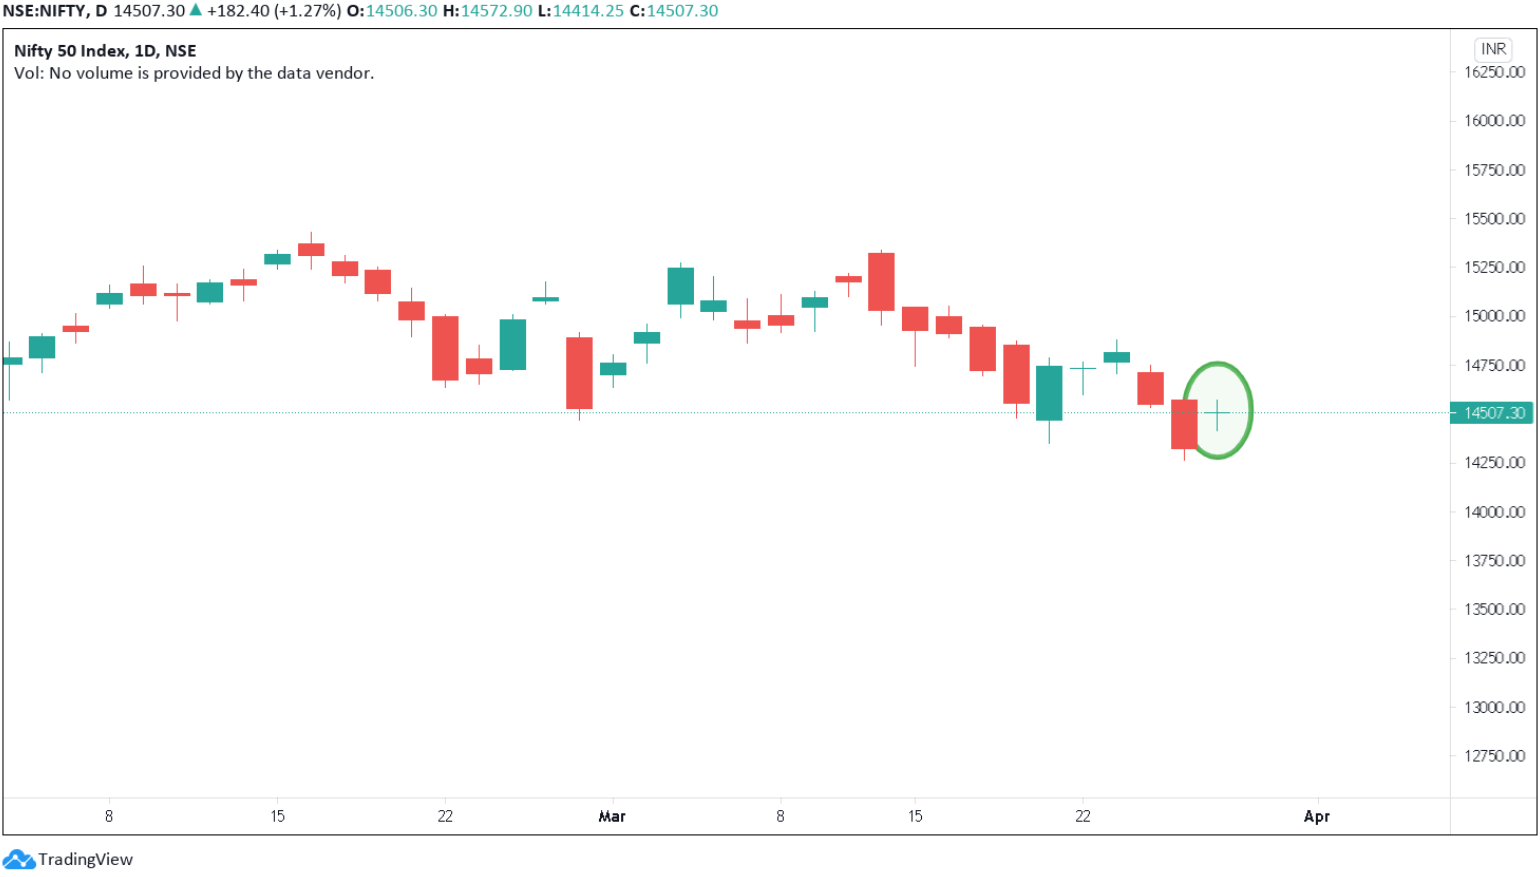
Doji candlestick

On Friday 26 March 2021, Nifty 50 formed a Doji candle in 1 day time frame. The opening price was 14506.30 and the closing price was 14507.30. The price
moved up and down but just closed 1 point higher and hence the doji candle
was formed on the chart.
(Tap on image for full screen view)
(chart from
www.tradingview.com)
Spinning Top Candlestick
Spinning top is similar to a Doji candle, it has a short body and the body is
located exactly at the middle of the upper and lower shadows. It also shows
indecisiveness.
Spinning Top Candlestick
Stock: West Coast Paper Mills
Time Frame: 1 Day
In the below chart a strong uptrend is seen after the spinning top candle.
(Tap on image for full screen view)


Hammer Candlestick
Hammer candlestick is a trend reversal pattern. hammer usually represents a
bullish trend. It appears after a downtrend. It has a short body and a
longer lower shadow.
Hammer Candlestick
Stock: Grasim Industries
Time Frame: 1 Day
In the below chart after a downtrend a hammer candlestick is formed and then
a strong upward movement is seen.
(Tap on image for full screen view)

Inverted Hammer Candlestick
Inverted Hammer candlestick is also a trend reversal pattern, it usually
represents a bullish trend. It also appears after a downtrend. It has a
short body and a longer upper shadow.
Inverted Hammer Candlestick

Stock: West Coast Paper Mills
Time Frame: 1 Day
In the below chart after a huge fall an inverted hammer is formed and then
the trend has reversed.
(Tap on image for full screen view)


Hanging Man Candlestick
Hanging man Candlestick is similar to a hammer candle but this appears
after an uptrend. It indicates a bearish reversal. There can be a small
upper shadow but it's not must.
Hanging Man Candlestick
Index: Nifty 50
Time Frame: 1 Day
In the below chart after a hanging man candle the price fell continuously
for 6 trading sessions.
(Tap on image for full screen view)

Shooting Star Candlestick
Shooting Star candlestick is similar to inverted hammer candle but this
appears after a uptrend and it's a bearish reversal candle. There can be
a small lower shadow but it's not must.

Stock: Reliance Industries
Time Frame: 1 Day
In the below chart after a strong uptrend a shooting star pattern is
formed and the trend was reversed.

Drop your comments in the comment section below.
Upcoming topics,
- Candlestick patterns - Part 2
- Support and Resistance